National Budgeting amidst COVID 19:Why 2020/21 National budgets should be revised and steps government could take
COVID 19 has been known for many reasons but for Tanzania and East African governments in general, the pandemic arrived at a very wrong time. Coming in the middle of national economic planning and budgeting for the 2020/21 financial year, the pandemic has totally ripped apart as much as it can all the basic economic fundamentals that governments had banked on in projecting their 2020/21 revenue and economic growth forecasts.
By Moses Kulaba, Governance and economic analysis center
Developed close to five years ago as Five Year National Development Plans, as they are known, the plans were modelled based on a myriad of positive assumptions and designed to achieve stellar economic growth targets.
According to the Ministry of Finance and Economic Planning, Tanzania’s economy was projected to grow at 6.9%. Kenya projected to grow by 6.2% while Uganda expected an outstanding growth of 6.3% during the 2020/21. But going by the havoc currently wrecked by the COVID 19 pandemic and the global statistics so far it is highly likely that these plans will be significantly affected.
According to the World Bank, the global economy will shrink by 3% in 2020 sending millions deeper into poverty. Sub Saharan Africa’s economic growth is expected to contract from 2.4% in 2019 to between -2.1 and -5.1% in 2020, sparking the region’s first recession in 25 years.
McKinsey & Company forecast that East African economy will shrink by 3% and 1.9% during this financial year. In East Africa, Kenya, under a contained-outbreak scenario, GDP growth could decline from an already reduced 5.2 per cent accounting for the locust invasion earlier this year, to 1.9 per cent.
Under a best-case scenario, Kenya is looking at a reduction in GDP of $3billion while South Africa could be whipped to a GDP growth fall from 0.8 per cent to 2.1 per cent, representing a reduction in GDP of roughly $10 billion, the reports indicate. Other sources such as have even made higher projections that East African economies may shrink by 5.4% in 2019. It is clear now that the economic impacts of the pandemic could be more catastrophic than their health dimension.
Why Tanzania should revise its Budget Estimates
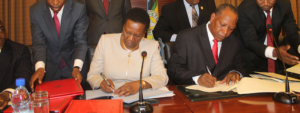
In the 2020/21 budget speech delivered to parliament in March 2020 by Tanzania’s Minister of Finance and Economic Planning the government projected to spend Tsh 34.879.8 billion for the implementation of its final year of the Five-Years National Development Plan (FYDP II) 2016/17-2020/21
The Minister highlighted that the Growth Domestic Product (GDP) had shown a positive trend, increasing at an average of 6.9% per annum for the period between 2016-2019 and government revenue collection had increased. The FYDP II indicates the government targeted to raise annual tax revenue collection from TZS 15,105,100 million during the FY 2016/17 to TZS 25,592,631 million during FY 2020/21, which translates into an increase in tax revenue to GDP ratio of 15.9 per cent by 2020.
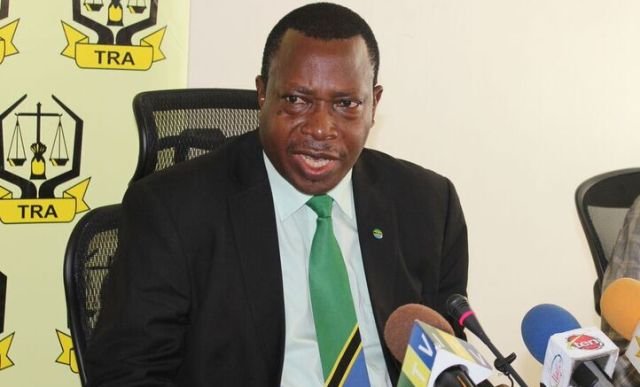
Although the period between July 2019 and January 2020 witnessed revenue collection targets hitting high levels with TZS 10.62 trillion, which is about 97% of the target for that period which was TZS 10.96 trillion, It is sufficient to anticipate that revenue collection starting the fourth quarter of 2019/20 will experience significant decrease as a result of COVID-19 impact in the economy.
The budget ceilings for the financial year 2020/21 indicate a 5% increase of the national budget from TZS 33,105.4 billion in 2019/20 to TZS 34,879.8 billion in 2020/21. The budget proposals presented in March 2020 by the Minister of Finance and Planning for 2020/21 projected raising domestic revenue collection from TZS 23.05 trillion in 2019/20 to TZS 24.07 trillion in 2020/21 which will be equivalent to 69% of the total budget estimates.
This is despite the clear indications that the 2020/21 budget will experience serious shortfalls never experienced before. The evidence from the economic shocks encountered so far with the closure of business, transport restrictions and exports such as horticulture, suggest tell that the current government’s economic plans and revenue projections for 2020/21 could be quite zealous and perhaps needed review.
According to the African Development Bank’s (East Africa Economic outlook report for 2019) economic growth in Tanzania and East Africa, in general, has been driven by tourism, services, agriculture and consumption sectors. Tourism and services sector in Kenya and Tanzania grew and maintained an upward trend for the past five years.
All these vital sectors have been significantly affected and will centris pari bus record negative growth in their last and first quarters of 2020. Both the formal and the informal sector have been massively hit by this global pandemic. The economy will undoubtedly shrink substantially and therefore this should be reflected in the 2020/21 national budgets.
Global projections show that travel, hospitality and services sector will significantly be affected. Kenya, the regional economic powerhouse has so far downgraded key sectors such as the tourism sector to projected growth of about 2% in 2019 and this could even worse.
According to the World Tourism Council, the direct and indirect contribution of tourism was 14% of Tanzania’s GDP in 2014 with USD 6.7bn. This was expected to rise by 6.6% annually in the next 10 years, according to the World Travel and Tourism Council (WTTC).
According to the Bank of Tanzania Monthly Economic Review report, the tourism industry was the main source of foreign exchange receipts by Tanzania in 2018. In the MER report for the year ending December 2018, travel earnings (dominated by tourism) increased due to a rise in the number of tourist arrivals. The earnings reached US$2.44 billion from US$2.25 billion tabled in the same period the previous year.
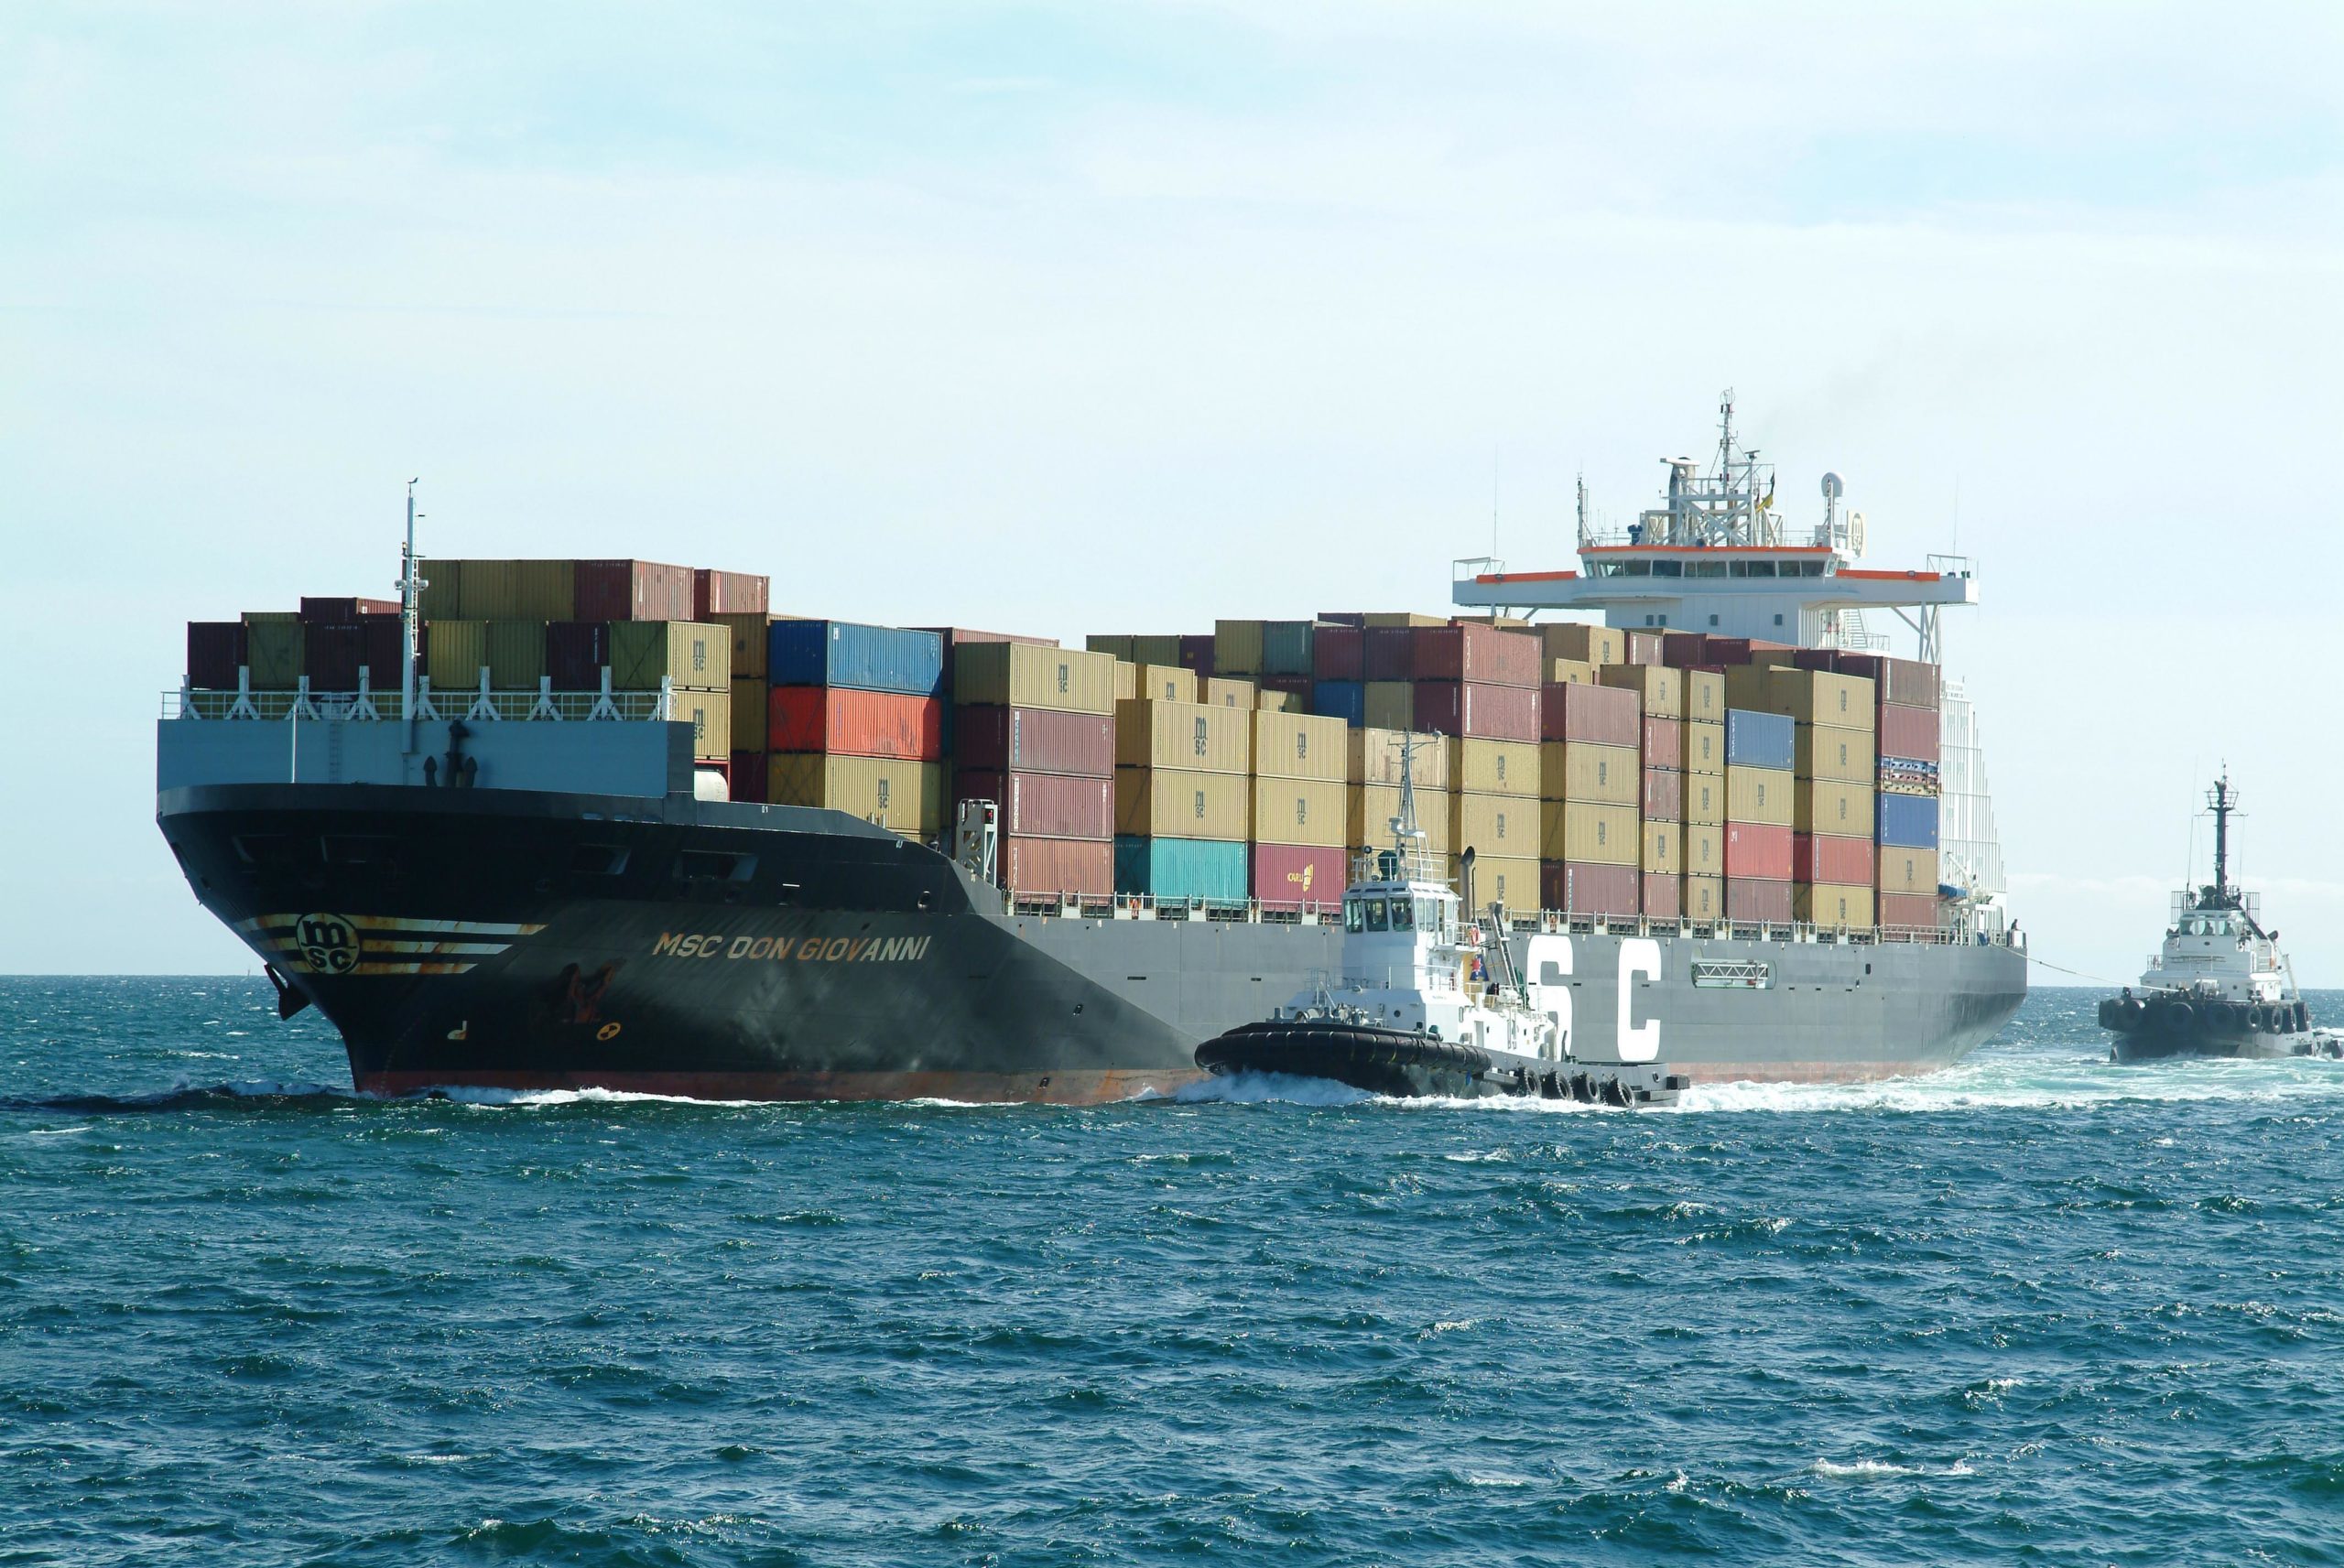
 The total receipts from services recorded a positive trend due to also the increase in the transport sector, which rose from $1.14 billion in 2017 to $1.22 billion in 2018. MER reported that following an increase in travel and transport foreign receipts, the total foreign exchange receipt from services was $4.01 billion in the year to December 2018, an increase of $182.8 million from the amount registered in the corresponding period in 2017
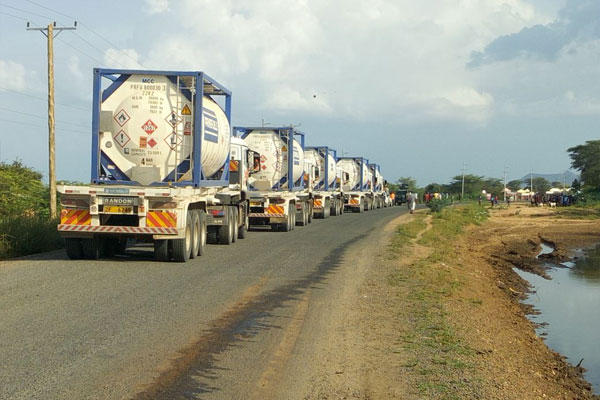
“Transport receipt increased due to growth in the volume of transit goods to and from neighbouring countries particularly Zambia, DRC, Rwanda and Burundi partly contributed by improved competitiveness at the DSM port, including removal of Value Added Tax on auxiliary services of transit cargo, the bank reported.
The current lockdowns and travel restrictions in the neighbouring countries clearly indicate that these gains will be thrown out of the equation.
Zanzibar as a major tourist destination will be significantly affected and this will pull down the overall national economic growth of the sector and its impacts on the country.
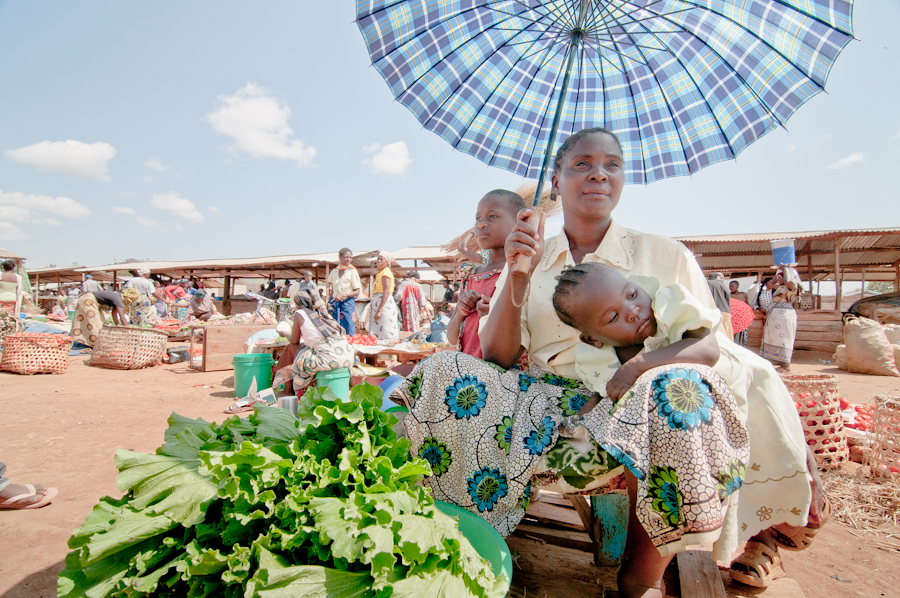
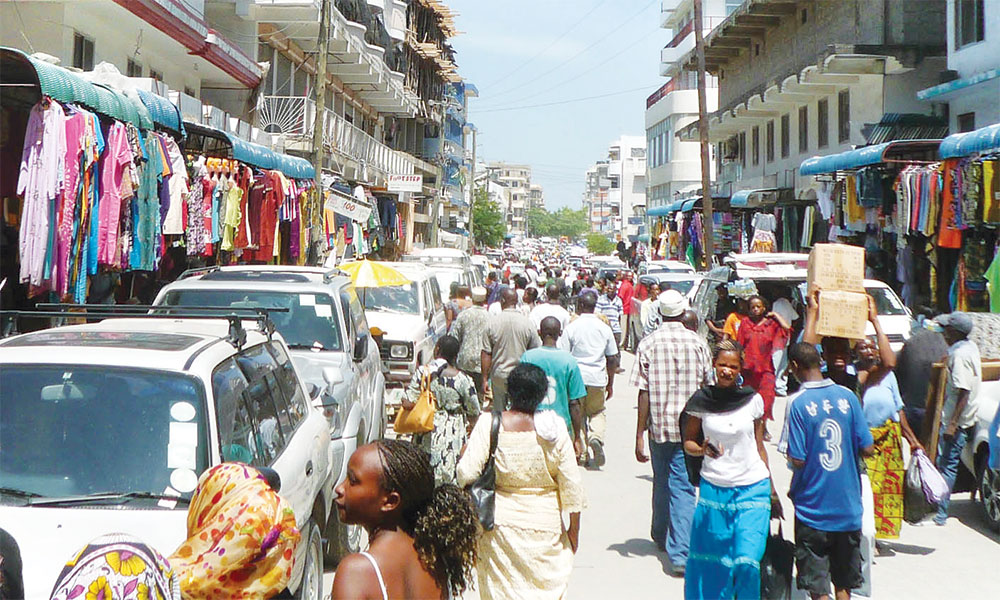
Production and consumption will equally be affected by the economic lockdowns, staff layoffs and economic distress as disposable incomes shrink and consumer’s marginal propensities to spend drastically reduce.
Agriculture which has always been taunted as the backbone of the economy will also be affected by the menacing locusts, floods and disruptions in agricultural chains for inputs and domestic and export markets. Lending towards the sector will likely be affected and large scale production curtailed. The net effect in the wake of this will be potentially increased food insecurity, high prices (food inflation) and famine in large parts of the country.
Government costs of health care and treatment will significantly increase, drawing away resources from investment in other social and development sectors. According to public health experts, COVID 19 is one of the most expensive diseases to treat. It draws a lot of resources as it requires specialized facilities, expertise and treatment to deal per capita patient.
The financial sector will be distressed. Non-performing loans have increased and will increase significantly in defaults, distressed assets and foreclosure. The government could be a net loser too as banks, entities and individuals experience financial squeeze, fall back in tax payments and doing with on matters financial such as the purchase of government fiduciary instruments, such as treasury bills.
The industrialization agenda mooted by the government five years ago will significantly be affected as foreign capital to investment becomes difficult to mobilise. The major source countries of FDI inflows into Tanzania such as China, Europe and the United States and South Africa have been the epicentres of the pandemic and struggled to cope.
The turbulence in the global stock markets in the key financial centres such as New York, Tokyo, Frankfurt and London has worsened the situation further as major companies saw their net value and investments wiped within a short span of two months. The balance sheets and bottom lines of major companies shrunk significantly and remain extremely stressed. During and immediately after the COVID 19, investors and companies will be conservative to invest en masse and choosy in which markets and type of business they invest.
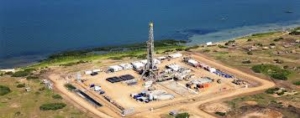
It is based on these realities that the Governance and Economic Policy Center and other Civil Society Organisations (under the umbrella of Tanzania Tax Justice Coalition) caution that the government needs to be precautionary in its projections and conservative in its estimates. As stated above that chances for the economy to shrink and domestic revenue mobilisation will adversely be impacted. It is likely that investment and revenues from key sectors such as tourism, construction and the extractive sector will likely be affected.
What governments should do
- Revise the previous and current budget projections to take care of the negative effects that COVID 19 will have on the economy and revenue mobilisation. (The World Bank and IMF both project that the African economy will shrink between 1.9% -3%). The new budget projections should factor this into their models to avoid a serious shortfall.
- Reduce VAT from the current 18% to 16% for the year 2020/21 to encourage production, tax rebates for manufacturers producing products for fighting Covid19, such as sanitisers, soap, masks and a well-reduced price for products hence increasing the purchasing power by consumers.
- The government should suspend all debt payments and re-negotiate future debt servicing in the context of COVID-19.
- Businesses and self-employed individuals in sectors hard-hit by the crisis or with serious repayment difficulties related to it should be allowed to reschedule their loan repayments or defer payments for a limited period (3 months). This will enable businesses and self-employed individuals in sectors hard-hit by the COVID-19 crisis or with serious repayment difficulties to remain in control.
- Halt or pause or stagger large expenditure on some large ongoing and proposed strategic projects such as infrastructure projects this year and reschedule the respective fund to short-term productive sectors for the economy and saving people’s lives.
- Set up an emergency fund or reserve fund at the Central bank capable of shielding the economy from the longer effects of COVID- 19 and the CB increase more liquidity into the banks to facilitate cheap lending.
- Businesses adversely affected by the COVID-19 should be given temporary tax payment relief in this regard. This should, however, be closely to avoid misuse.
- The governments need to earmark existing or additional funds to reinforce all mechanisms to fight COVID-19.
- Protect the public and consumers from hoarding, price hikes and disruptions in the supply chain of vital goods and services, which could gradually drift the country into structural inflation, affecting further the poor and extremely economically vulnerable.
- Consider pay cuts for highly paid public servants transfer some of these savings towards the national fund to finance COVID 19 response mechanisms
- Take measures that shield the private sector from collapse, protect jobs and hence protecting the government’s vital tax base.
- External borrowing at this stage to fight COVID-19 could be extremely dangerous as it is not exactly known when the situation will return to normalcy and the economy could be badly beaten after COVID-19 and not able to meet the ability for the government to pay its debt without default.
East African governments have been victims of ambitious budgeting appetites, whose targets are never achieved. According to a review of budget trends by GEPC in 2018/19 showed there were perpetual shortfalls between what was projected and what was collected. The trend showed that budgets estimates had been increasing over the years with every year’s budgets touted as the highest since independence. However, the actual budget out turns had fallen short of projections.
Kenya, which is the biggest economy in the region had missed targets for the past seven years while Uganda was a perpetual budget crusher with key ministry asking for supplementary budgets midway.
In 2018/19 Tanzania recorded a shortfall in budget outturn only achieving 88% of its targeted revenue collection. This was attributed to a number of factors, decline in domestic revenue, tighter global conditions, decline and delayed disbursement in government.
Generally, governments were net beggars, relying heavily on domestic and external borrowing to fill their budget deficits. Very little was saved. For this year, the signs are all over that the economies are glaring into the abyss. Cautionary budgeting could save the economies from further meltdown.