National budgets are statements of how the government plans to raise and spend public money. They are based on fundamental economic parameters which inform planning. Looking at the budget proposals and given the unusual current economic realities that the Finance Ministers found themselves in, this year’s budget can be described as largely ceremonial after all. In This brief commentary, we show why.
By Moses Kulaba; Governance and economic analysis centre
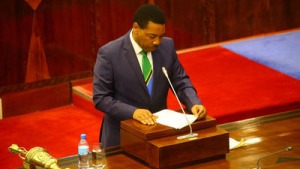
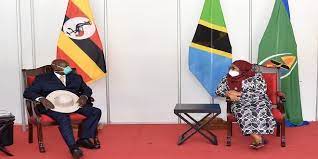
On Thursday, 11th June 2020, the Finance Ministers in Tanzania, Kenya and Uganda presented their annual budget estimates for the year 202/21. While Tanzania pitched its budget as one for nurturing industrialisation for economic transformation and human development, the Kenyan Budget was presented as a budget for growth while Uganda’s budget was presented as one for consolidation and continuity towards achieving the Five-year development plan.
Conservatively defined, a national budget is a statement of how government plans to raise and spend revenue or public money collected from various domestic and external sources. Domestically, the government largely raises revenues through taxation and externally through borrowing and grants.
Looking at the budget proposals and given the unusual current economic realities that the Finance Ministers found themselves in, this year’s budgets can be described as largely ceremonial after all. The macro economic parameters of which the budget projections were based are hollow when subjected to the test of COVID 19. There were all indications that the Ministers would soon come back to parliament asking for supplementary budgets before the end of this financial year.
Indeed, the Finance Minister, Mathia Kasaija told Uganda’s Parliamentarians, that the COVID 19 pandemic had necessitated changes to the budget and he would come back seeking approval for a supplementary budget to reflect the true realities. A similar sentiment was echoed by Kenyan legislators and policy experts, who expected the Treasury Minister, Mr Ukur Yatani, to return to parliament sooner than later with a more aligned budget.
The Daily Nation newspaper summed up the Kenyan National proposals as a ‘Budget for bad times’, while the Kenyan Standard described it’s a ‘Nightmare budget’, stressed with Corona virus, lost jobs, empty coffers, shrinking revenues, huge debts, funding gaps, which all combined to under cut the treasury’s ambitions. In summary, the budget added more pain to the already suffering Kenyans.
So what was contained in the budgets which make them peculiar, largely symbolic and ceremonial.
Key items of the budget frames
| Budget Item |
Kenya |
Tanzania |
Uganda |
| Economic Growth projections |
2.5 % |
5.5% |
3.1% |
| Total Proposed Budget |
3.4trln ($27Bln) |
34.88tln ($20bln) |
45tln ($12Bln) |
| Domestic Revenue |
2.79trln |
24.07trln |
25.5trln |
| Deficit ( to be financed thru external borrowing, grants and other measures) |
840.6bln (7.5% of GDP) |
10.81trln |
20 trln |
| Latest National Debt & Debt to GDP |
63% (6.4trln) |
55.43tln (27.1%) |
USD 13.3bln (Approx 43.6%) |
From the figures and proposals contained in the budget speeches, it was evident that the finance Ministers were reading from a script of optimism and perhaps missed a big picture. Tony Watima, an economist writing for the Standard Newspaper’s ‘Business daily’ concluded that positioning of the Kenyan budget as pro-growth was misguided. Stabilisation should have been the tenor of this year’s National budgets.
The East African was franker in its editorial when it wrote; ‘Finance Ministers owe Citizens the truth on budgets’. The Editor noted that despite the unusual circumstances, the Finance Ministers struck an optimistic positive, calculate perhaps to lift the spirits of a region weighed down by the ripple effects of varying levels of COVID 19 related to lockdowns.
Given, the recent changes to the budget policy and public finance requirement, clearly the Finance Ministers, perhaps could be excused. They were caught between the law and COVID 19, the Finance Ministers found themselves in a tight corner. Having prepared the budget statements before March, they had to present what they had.
The Kenyan Constitution, for example, requires the government treasury to disclose to the public spending plans two months before the end of the financial year. In Kenya, a court ruling directed that the treasury publishes the finance bill earlier so parliament can debate in parliament. The Annual Budget Policy Statement (“the BPS”) was issued in February 2020 and as the CS rightly pointed out, the economic environment had vastly changed from what they found themselves in June. Similarly, in Tanzania and Uganda, the budget policy framework papers were passed months ago.
Realities of COVID 19 on the economies
The negative realities of COVID 19 on the economies are everywhere. The key economic sectors have all been affected. Within a short span of three months, nearly 1 million Kenyans had lost jobs, several companies had closed operations while many were on the edge. Revenue collections had plummeted and some revenue streams were on the verge of total disappearance. Kenya, East Africa’s largest economy was in free fall with rising unemployment and disruption in major economic sectors. Uganda’s economic fundamentals were in tatters while Tanzania appeared to live in self-denial of the current and long-term adverse economic effects of COVID 19. The Minister admitted that COVID19 had affected the economy but was upbeat that measures had been taken to circumvent the pandemic.
Kenya’s Finance Minister was more optimistic with an estimate of the growth at 2.5% in 2020 and 5.8% in 2021. Pre-the pandemic the economy was projected to grow at 6.1% up from 5.4% in 2019. The IMF projected that global economies were expected to contract by as much as 3% growing to 5.8% in 2021 and Kenya was expected to grow at 1% in 2020. Kenya’s revenue collection by April 2020 was Ksh 20.1 Billion-lower than the same month last year and below target. The fiscal deficit in 2019 was 8.3% up from 6.3% in 2018.
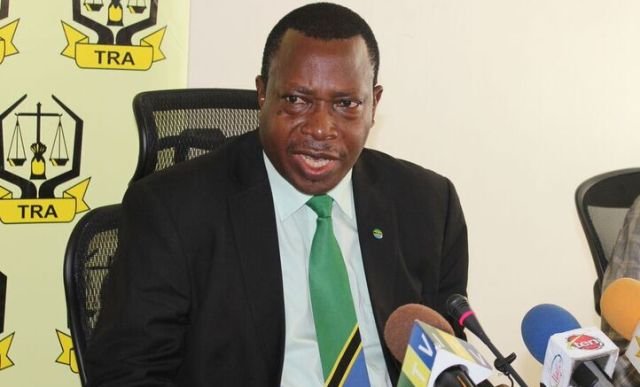
In Uganda revenue collection by April 2020 fell by Ush789.8bln below targeted Ush1.8trln. This was the largest deficit ever recorded in a single month. With the lockdowns, there was no way URA could meet its target. Tourism and business sector was largely affected. 80% of agricultural businesses and 41 Manufacturing had reduced production and employment. Yet, these contribute to the largest share of tax revenue. Agriculture accounts for 45% of exports and employs 64% of all Ugandans. Uganda expected to receive US128bln grants from donors but had only received Ush28bln. All projections were below target.
In Tanzania, the affected areas included tourism, business (wholesale and retail), traditional export crops such as cotton, cashew nuts and coffee. On 8th of June, just three days to the budget day, Tanzania’s Dar es Salaam Stock Exchange (DSE) recorded zero tradings at its equities counter. This signified an economy under distress and barely recovering from loses of COVID 19. Yet, Tanzania’s Finance Minister projected an increase in revenue collections from 14.0% in 2019/20 to 14.7% in 2020/21.
Response measures are taken
The governments undertook some fiscal and tax administration reforms and provided some stimulus packages aimed at cushioning the economies against the pandemic. However, when deeply analysed, the measures were based on shaky economic grounds, expensive in revenue foregone, difficult to achieve and can not guarantee to reverse the negative impacts of COVID 19.
Summary of some COVID 19 related response measures taken in 2020/21 budgets
| Kenya |
Tanzania |
Uganda |
| Concessional Loans from External Lenders (IMF & WB) amounting to USD 739Mln and USD1Bln |
Negotiated debt relief of USD14.3Mln and potentially up to USD25.7Mln under IMF Catastrophe Containment Relief fund. Ongoing negotiations with other donors |
Concessional Loans (IMF & WB) –USD100Mln in 2020 and 90 Mln in 2021 and negotiation for debt relief. |
| Reduction of CBR from 8.25% to 7% and Cash Reserve Ration from 5.25% to 4.25%-Releasing 35bln to commercial banks |
Reduction of BoT Discount rate from 7% to 5% , Lowering statutory Minimum Reserve Rate (SMR) from 7% to 6% |
Reduce BoU Central Bank Rate from 9% to 8% |
| Turn over tax rates reduced from 3% to 1%, Allowance for restructuring and rescheduling of distressed loans by commercial banks and lenders |
Reduce the cost of Mobile Money transactions by Increasing daily minimum transfers from 3Mln to 5Mln and Minimum balance from 5mln to 7 Mln |
Extension of time to file Income taxes or presumptive tax for six months |
| KSH 10 Bln for Kazi Mtaani Vijana Program targeting 200,000 youth, recruitment of teachers and health workers |
Zero-rating of import duty on raw materials for COVID 19 Manufacturers sanitizers, PPE Masks |
Local Manufacture and purchase of PPE for free distribution to all Ugandans |
| Reduction of VAT from 16% to 14%, Reduction of Corporate tax from 30% to 25% |
100% allowable deductions on contributions in support of government’s COVID 19 response |
Ush130bln for vulnerable but able-bodied persons affected by COVID19 |
| Reduction of PAYE for low earners of up to Ksh 24,000 per month |
Allowing loan restructuring and rescheduling, VAT exemption on Agricultural Crop insurance |
Ush1.045bln to UDB for low-interest credit to manufacturers agribusiness |
| 500 mln for purchase of locally made hospital beds and 600mln for purchase of the locally assembled vehicles |
Abolishment of over 144 levies charged by MDA and Local Authorities for an improved business environment. |
Ush138 to UDC to facilitate public-private import substitution investment |
| Ksh18.3bln to support local manufacturing, 3bln for Agric Credit Guarantee schemes, 400 million in food and non food commodities to household affected by COVID 19 |
Subventions to TANAPA, NCAA, TMWA to meet their operational expenses, Increase minimum threshold of Primary SACCOS liable to income tax for 50,000,000 to 100,000,000 |
Provide Credit through SACCOs and Micro-Finance Institutions |
What was missed?
The plans and fiscal reforms were taken as if the economy would be normal.
The trend shows that the finance Ministers planned normally and even increased their budgets estimates, despite the odds and indications that the outturns were likely to be suppressed by COVID 19. The law firm Bowman’s noted that Budget speeches did not necessarily provide any solutions to the perineal challenges the countries faced and in some ways simply repeated what we have heard before.
What have been the budget trends?
| Country |
2017/18 |
2018/19 |
2019/20 |
2020/21 |
| Kenya |
Ksh 2.3bln |
Ksh 2.5bln |
Ksh3 trln |
Ksh 3.4trln |
| Tanzania |
Tsh 31.7trln |
Tsh32.4trln |
Tsh 33.11trln |
Tsh 34.88trln |
| Uganda |
Ush 29 trln |
Ush 32.7 trln |
Ush 40.487trln |
Ush45 trln |
The actual budget out turns has fallen short of projections. Kenya, which is the biggest economy in the region has missed targets for the past eight years. In 2018/19 Tanzania recorded a shortfall in budget outturn only achieving 88% of its targeted revenue collection. Tanzania had collected 26.13trln (93.4%) of its budget by the end of April 2020. Uganda Tax Revenue Authority had perennially missed its targets. In the current environment, it is very unlikely that the economy will bounce back before 2021 and by all accounts, 2020 was going to turn out the tough year.
In Uganda, the budget was not significantly different from the previous Budgets.
Table of Uganda’s sectoral allocations
| Sector Allocation |
Approved Budget 2020/21 |
% share |
Approved budget 2019/20 |
% share |
| Works & Transport |
5,846.00 |
12.85% |
6,404.60 |
15.82% |
| Security |
4,584.68 |
9.90% |
3,620.80 |
8.94% |
| Interest Payment |
4,086.50 |
8.98% |
3,145.20 |
7.77% |
| Education |
3,624.06 |
7.97% |
3,397.60 |
8.39% |
| Health |
2,772.91 |
6.10% |
2,589.50 |
6.40% |
| Energy & Minerals |
2,602.60 |
5.72% |
3,007.20 |
7.43% |
In Kenya, the 10 bln stimulus packages offered youth employment under the Ajira Mtaani program appears generous. However, experiences from the past indicate that stimulus packages never trickle down to the real people who need them. This was the case with the maize stimulus package passed during the maize shortages in 2017. The scandals that have rocked the National Youth Service program for years further underscored the weakness of Kenyan institutions in managing affirmative budget programs such as these. Kenya’s imposition of tax on pensioners was clearly off the mark as it indicated that perhaps the government was robbing from the elderly to reward the youth and wealthy.
The agricultural sector which had already been devastated by the floods and locusts a received a raw deal in Kenya and Uganda. The post-COVID 19 scenario presents the region with significant food insecurity. There is likely for a surge in food prices, squeezing further on the household incomes.
Yet, in Uganda, the Ush 1.3trln (2.9%) budget allocated to the agricultural sector was equivalent to that allocated to Uganda’s Public administration. Uganda’s Parliament accounted for Ush 667.78bln equivalent to half of the total budget allocated to the Agricultural sector.
As Ms Salaam Musumba, a Ugandan political activist said, people, expected a clean cut for political niceties such as for conferences, meetings, benchmarking on foreign travels, health care abroad, etc. However, this was not reflected in the budgets.
In Kenya, the Governors, MCAs and their political handlers account for a substantive portion of the recurrent budget. Kenya’s parliament received a budget twice that of the entire Judiciary. In 2020/21 some political offices such as that of former Prime Minister even received 100% budget (Ksh 71.9Mln) allocations for first time since they were created.
Generally, East African public services are bloated with public servants and money guzzling politicians and their handlers, who have become too expensive for governments to carry, yet, politically costly to offload. As a net effect, the recurrent expenditures have increased tremendously to take care of this political baggage and the entities associated with this. The Finance Ministers could do nothing to reduce taxpayers of this burden.
In Tanzania, the government did not provide much booster to the tourism sector which is a leading foreign earner. The sector has faced the largest hit from COVID 19. The government instead took away powers to collect tourism-related revenues from the authorities Tanzania National Parks Authority (TANAPA), Ngorongoro Conservation Area Authority (NCAA), Tanzania Wildlife Management Authority(TWMA) to Tanzania Revenue Authority (TRA). The revenues collected from these authorities would be directly remitted to the consolidated Fund and disbursed back through normal government budget channels. The government would provide some subventions to keep the operational and development expenses of the authorities afloat.
The Finance Minister acknowledged that Tanzania’s flagship projects aimed at putting Tanzania back to a spurring economic path faced 11 risks including COVID 19, which had affected the global economies and financing environment. The government planned to raise and spend Tsh 12.78 trln (27%) of the budget on mega infrastructure projects. According to the Minister, an evaluation conducted in April showed that the Country had not been badly affected by the pandemic, allowing it to raise its growth forecasts and maintain firm financing for its mega-development projects.
However, the truth is that the real impacts of COVID 19 on countries such as Tanzania, which are not interlinked to the global financial systems take a while to be registered and will likely be evident in the 4th Quarter of this financial year and 1st to 2nd Quarter of the new financial year 2020/21 as distressed economic sectors and business begin filling distressed tax returns for income and corporate tax purposes.
Political –economy risks underestimated
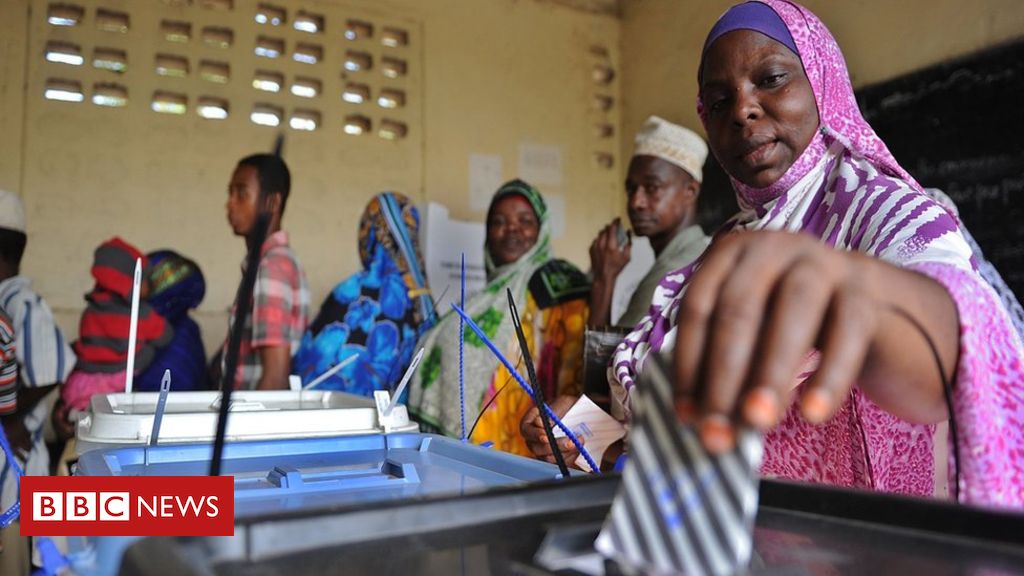
The budgets underestimated the political risks that were associated with the national general elections taking place in Tanzania (2020) and Uganda (2021) during this year’s financial year. Election seasons are largely characterised with politicking and less to production. Investment decisions and external donor commitments tend to be staggered as foreign investors and donors weigh the political barometer and wait for the electoral results and policy directions of the new government.
The electoral environment in East Africa has often been adversarial and conflictual. In Uganda and Kenya, the political environment before and during elections is often characterised with political turbulence and violence to the extent that the fundamentals of the economy, such as insecurity and government paralysis rocks the key production and business sectors of the economy.
Although, the Kenya general elections will take place in 2022, the political tension that characterises Kenya’s electoral politics had been building before being slowed down by the COVID 19 in March. It is likely as soon the lockdowns are eased, Kenyan politicians will be back to their usual political tirades and overtures. Tanzania’s Finance Minister acknowledged that political instability in the neighbouring countries, region and globally was an external risk. It did not acknowledge that it was an internal risk too and did not provide any mitigation against this risk on the economy and investment in 2020/21.
Clearly, the budgets were based on a positive scenario that COVID 19 would end soon. But given the trends, we can ably project that the journey of return to full economic recovery will be quite long. The likely upturn under a suppressed Corona Virus environment would be towards the third quarter of 2021.
Under a suppressed COVID 19 situation, the economy was still expected to shrink further by 1%. In a worst-case scenario, the economies would shrink by at least 2% significantly affecting the key revenues sources. Governments would lose further revenue through the stimulus packages offered. For example, Kenya expected to lose cumulatively Ksh172bln to cushion vulnerable Kenyans and the economy from the vagaries of COVID19.
It was no wonder that the editor for the East African concluded, that coming against a backdrop of a back to back missed targets by the taxman and uncertainty around COVID 19 and global economy, this year’s budgets are either based on an informed optimism or simply a bluff. We conclude that this year’s budget estimates were symbolic and the Ministers would return.
Recommendations or take waypoints for budget stakeholder.
- Tax Payers-Ready for engagement with government on real measures that will save
- Investors- Take precautionary measure and monitoring the economic trends, avoid taking decisions which will worsen the situation further.
- Governments-Remain conservative in expenditure and open for re-negotiation with taxpayers and adjustments of the budgets to fit the unusual 2021
- Citizens- Expect changes in the budgets as the effects of COVID 19 bite harder, minimise luxurious consumption and expect a tight budget.
Indeed, as noted by the legendary Economist and tax theorist Adam Smith:
There is no art which one government sooner learns than that of draining money from the pockets of People-Adam Smith


 The Uganda government has signaled a new impetus in the mining sector with multiple reforms and political weight over the next five years yielded to transform, its previously dormant mining sector. The government plans to scale up its work in the Mining sector. As part of improving its geological data, the government recently announced commencement of aerial surveillance of Karamoja, which is one of the areas highly believed to be mineral rich. This will improve the quality of real time Mineral and geological data.
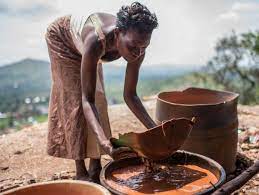
 The East African Oil Pipeline project received significant boots in April 2021 with Uganda with a series of key oil infrastructure related agreements signed between the government of Uganda and Tanzania and the oil companies for the East Africa Crude Oil Pipeline (EACOP) project to transport crude from Uganda to the Tanzania port of Tanga.
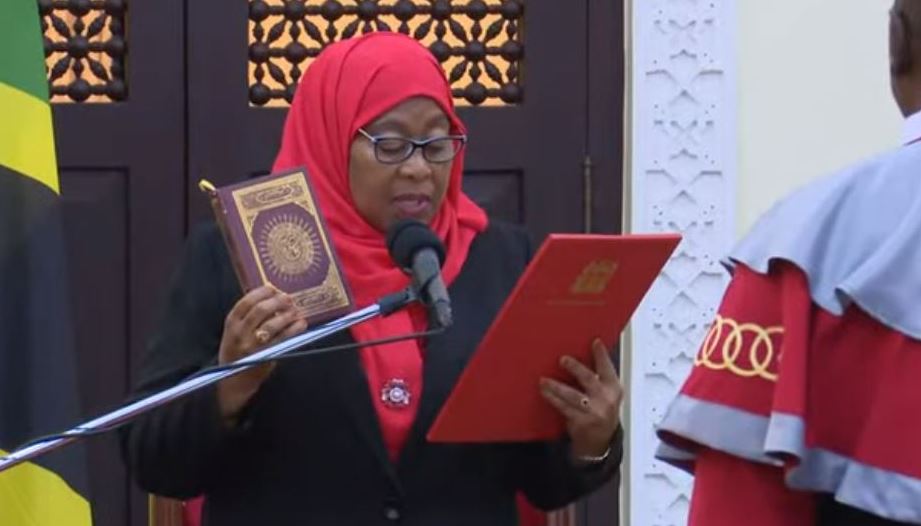
 In March, East Africa was gripped with shock upon the sudden death of Tanzania’s President John Pombe Magufuli. Over the past five years, President Magufuli towered like a political colossus, led with a nationalistic approach, and pursued reforms which sent zillion sentiments across many frontiers. He threw out Accacia, Barrick’s Mining subsidiary in Tanzania, for tax evasion and dubious practices that he descried as stealing against Tanzanians. Enacted new mining laws and renegotiated a 50/50 sharing deal with Barrick which has since been mirrored as a template in other Countries far away such as Papua New Guinea. However, his style was considered as a possible deterrent to potential investors and perhaps disruptive to the extractive sector.
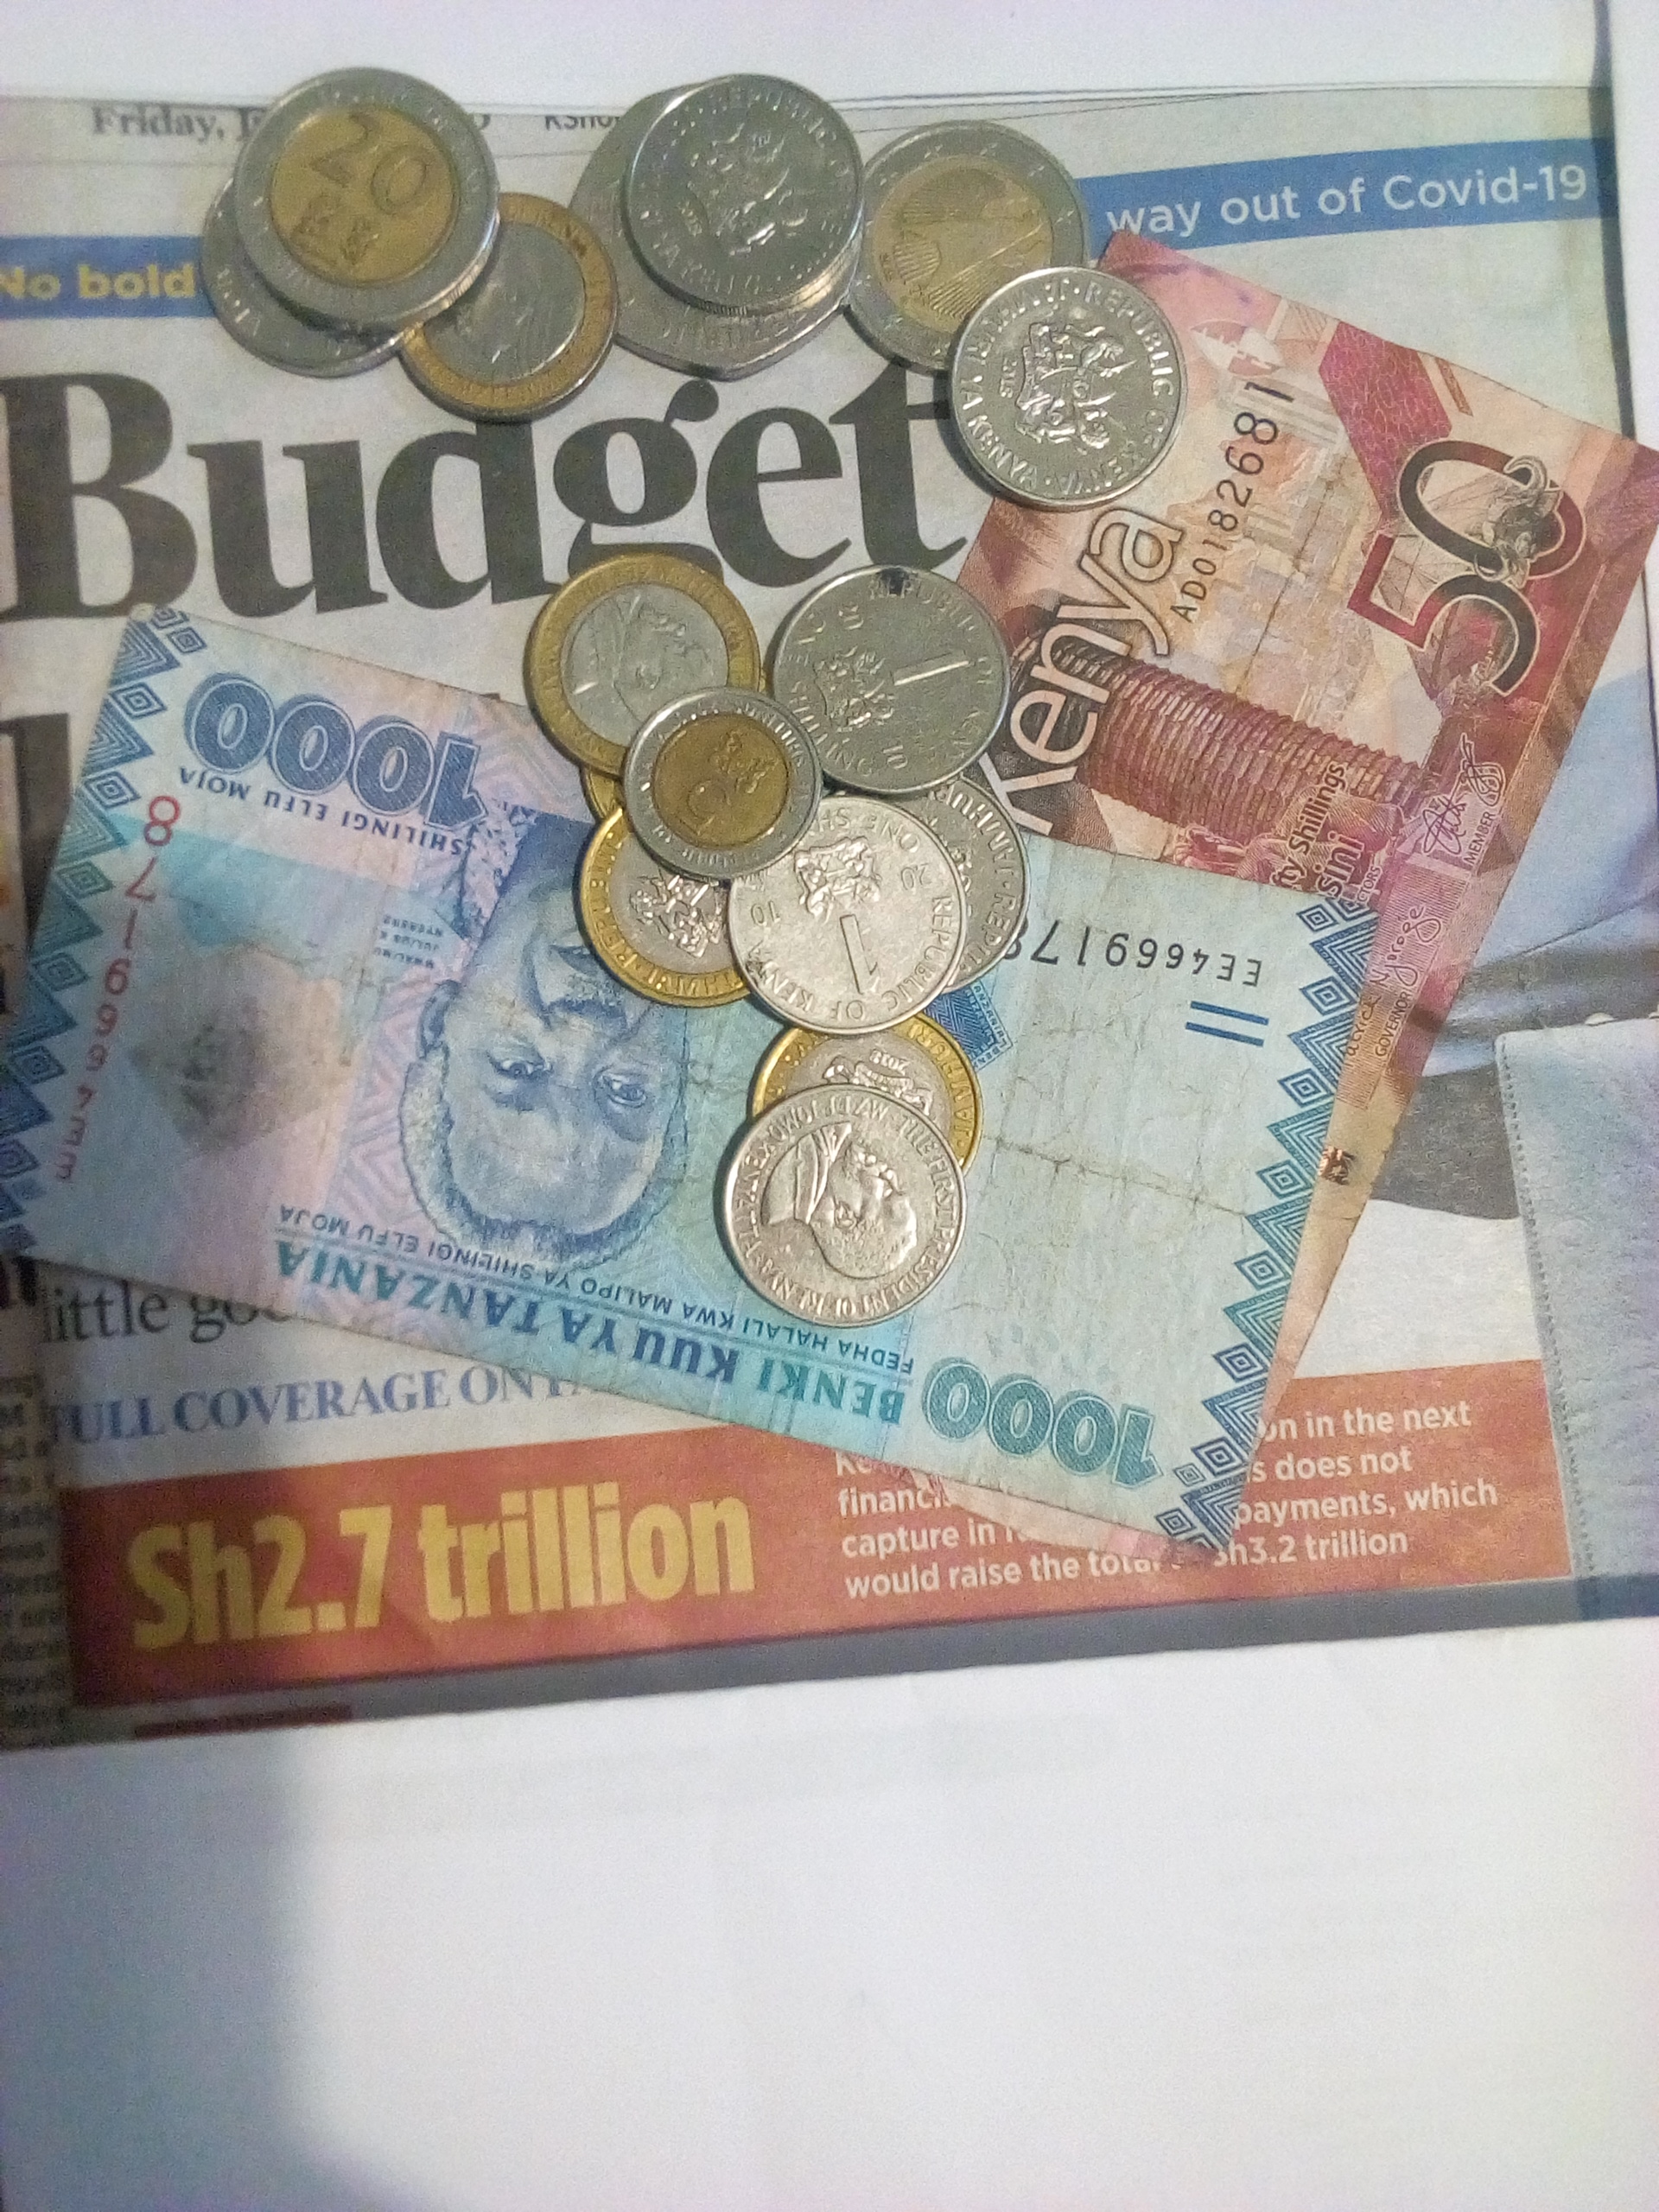
 The total receipts from services recorded a positive trend due to also the increase in the transport sector, which rose from $1.14 billion in 2017 to $1.22 billion in 2018. MER reported that following an increase in travel and transport foreign receipts, the total foreign exchange receipt from services was $4.01 billion in the year to December 2018, an increase of $182.8 million from the amount registered in the corresponding period in 2017